Our dragon genetics games have engaged thousands of students for many years. In that time, teachers have asked for an easy way to track their students’ progress and performance. Until now, teacher reports have been difficult to pull out of our system and impossible to parse in real time. The GeniGUIDE project, in partnership with North Carolina State University, is developing a teacher dashboard to accompany our new Geniventure software. We are currently piloting the beta version of this dashboard in multiple classrooms in Maine, North Carolina, New Jersey, and Massachusetts.
“A dashboard is a visual display of the most important information needed to achieve one or more objectives that has been consolidated on a single computer screen so it can be monitored at a glance.” – Stephen Few
Our dashboard displays information processed by an Intelligent Tutoring System (ITS) integrated into Geniventure. As students complete challenges in the game, they are rewarded with different color crystals for their accomplishments (Figure 1). Students who complete a challenge efficiently and without mistakes receive a blue-green crystal. Those who make a small number of missteps receive a yellow crystal while those with more mistakes receive a red. A black “try again” crystal is given to a student with too many mistakes to move on. As students level up through the missions, the ITS builds a model of conceptual understanding of specific learning goals. As student performance on these concepts improves over time, evidence that they have a solid understanding grows stronger.
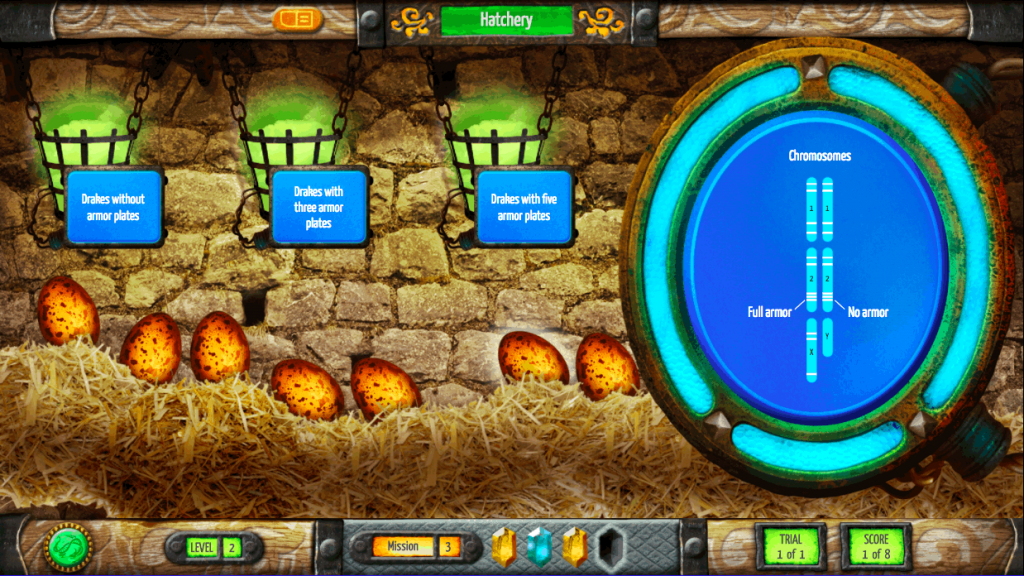
Figure 1. Student view within Geniventure of the colored crystals (bottom of screen).
Our preliminary teacher dashboard design (Figure 2) was guided by three factors. First, we looked back at our many years of classroom observations of teachers who implemented our suite of dragon genetics games—from our most recent Geniverse to GeniGames and BioLogica—and asked: What information could have helped teachers better facilitate student use of the game? Second, we examined recent dashboard designs implemented in prior Concord Consortium projects to help us distinguish between in-class and after-class use. Finally, we looked at other teacher dashboards that are currently available on the market.
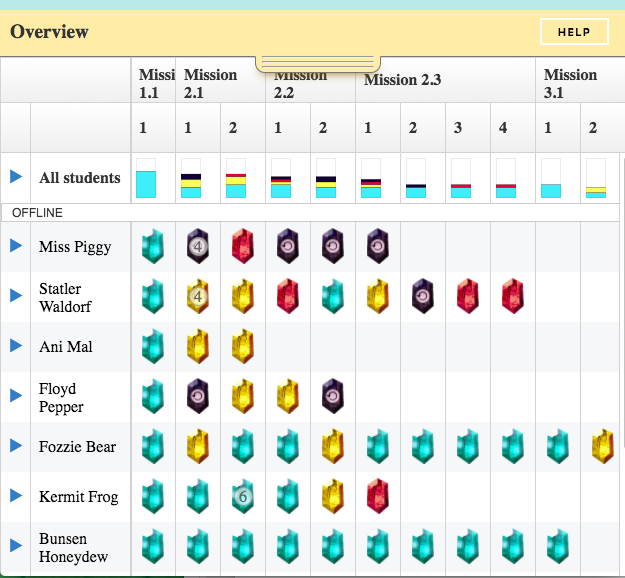
Figure 2. Beta version of Geniventure teacher dashboard.
During the pilot testing, we’re closely observing how teachers use the primary view of the dashboard, which provides information on both student progress and performance during class time. We hope to answer the following questions:
- Can the teacher adequately track student progress through the game?
- When do teachers intervene and when do they allow students to struggle? (Do teachers first help those students with black or red crystals?)
- Do teachers look at how many attempts a student made at a challenge?
- If teachers notice that particular students are ahead of the class, what actions do they take?
The dashboard also displays a graphical representation of student understanding of genetics concepts highlighted in the game. Some concepts are directly related to specific student actions (e.g., two recessive alleles are required to produce a recessive trait) while others are calculated based on performance across certain challenge types (e.g., genotype to phenotype mapping). The teacher can delve deeper into these secondary reports to view not only individual student data (Figure 3), but also aggregated class data (Figure 4). Through classroom observations and interviews with teachers, we hope to determine:
- Do teachers have the time and bandwidth to make sense of the concept understanding graphs during class?
- To what extent do the concept graphs help teachers understand where individual students, or the entire class, are having trouble?
- What action, if any, do teachers take based on the concept graphs?
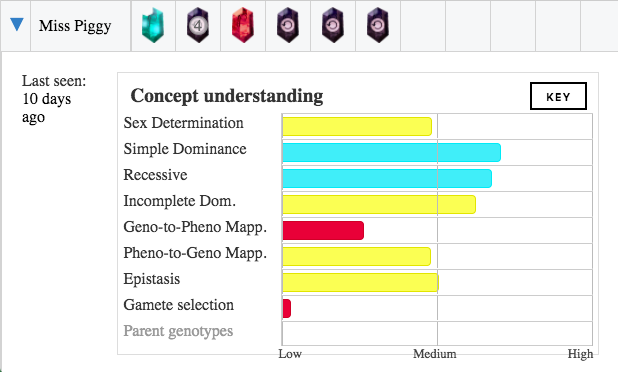
Figure 3. Display of individual student’s conceptual understanding.
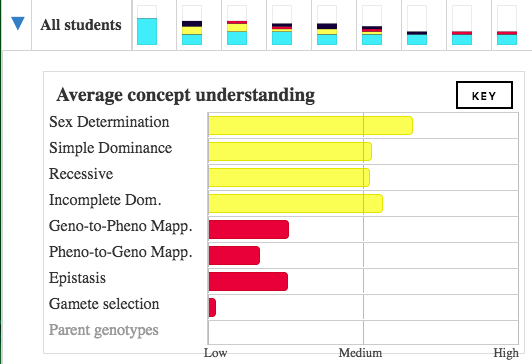
Figure 4. Representation of class average conceptual understanding.
As our ITS becomes more sophisticated, we plan to widen the concepts we track and make better use of student data to inform teachers.
How do you make use of dashboards? Let us know what features you’d like to see as we improve our ITS-enhanced dashboard.