 |
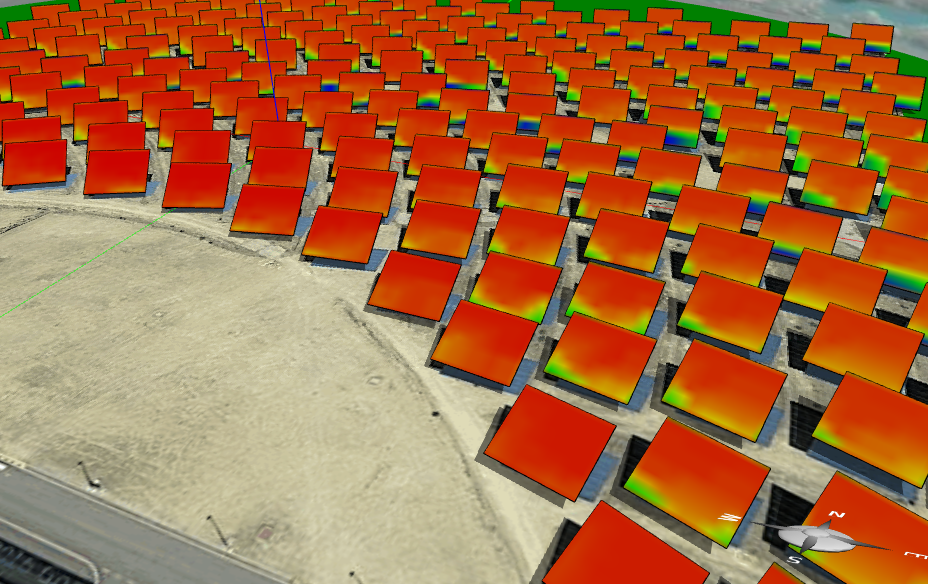
| Fig. 1: PS20 field output heat map (June, 22) |
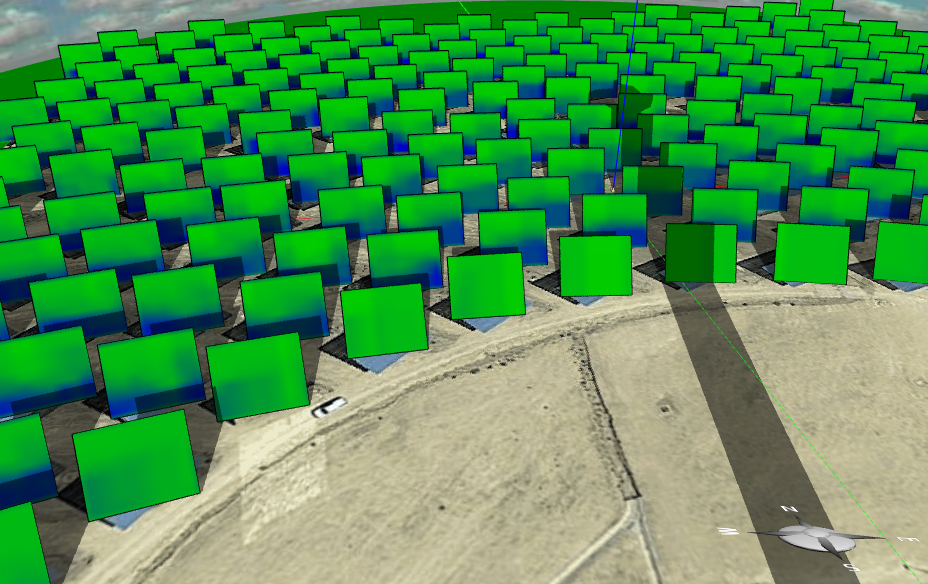 |
| Fig. 2: PS20 field output heat map (December, 22) |
 |
| Fig. 3: Fermat spiral layout (6/22, Phoenix, AZ) |
In an earlier article, I have discussed the concepts and issues (shadowing, blocking, cosine efficiency, etc.) related to the design of heliostat layouts for concentrated solar power (CSP) tower stations. I also showed that these problems can be nicely visualized in Energy3D so that people can immediately see them. Instant visual feedback in design time may be very useful to a designer (in fact, this is known as concurrent analysis in the CAD/CFD community, meaning that the tasks of structure design and function simulation run immediately after each other to shorten the wait time between ideation and analysis). Figures 1 and 2 are the heat map visualizations of PS20, a CSP station in Spain, that instantly suggest the possibility of minor blocking problems for some heliostats in the summer and winter. The heat map on each reflector is based on the reflected portion of the direct solar radiation onto a 8 x 8 grid on the reflector plane. Hence it already includes shadowing loss, blocking loss, and attenuation loss. And you didn’t read the image wrong, each heliostat reflector has a whopping area of 120 square meters (12 x 10 meters), dwarfing the vehicle in the image!
This blog post features several new tools that were just added to Energy3D to support the actual design tasks.
 |
| Fig. 4: Variations of layouts |
The first tool is a field layout wizard that provides basic steps for customizing three different types of layout: circular, rectangular, and spiral. It allows you to select the width and height of the heliostat reflectors as well as a variety of parameters to automatically generate a layout. Of course, you can also easily copy and paste to create linear arrays of heliostats to create rectangular layouts. But the wizard does the job faster. Rectangular layouts can be seen at the Jülich Solar Tower in Germany and the Delingha Solar Tower in China. The latter just went into operation this August.
Note that, in Energy3D, the heliostat field must be built on top of a foundation. The size of the foundation you draw sets the boundary of the heliostat field. As the field layout must be done on a foundation, the layout wizard can only be accessed through the popup menu of a foundation.
The spiral layout that Energy3D supports (Figure 3) is an interesting addition. It currently provides the Fermat spiral, which is the pattern you see from a sunflower head. It is so amazing that solar science seems to always go back to the sunflower. The solar trackers for photovoltaic arrays mimic the motion of sunflowers to follow the sun. The spiral pattern of a sunflower head may hold a key to optimal heliostat layouts (Noone, Torrilhon, and Mitsos, Solar Energy, Vol. 862, pp. 792–803, 2012). This may not be too surprising considering that the sunflower has probably evolved into that particular pattern to ensure that each seed has enough room to grow and fair access to sunlight.
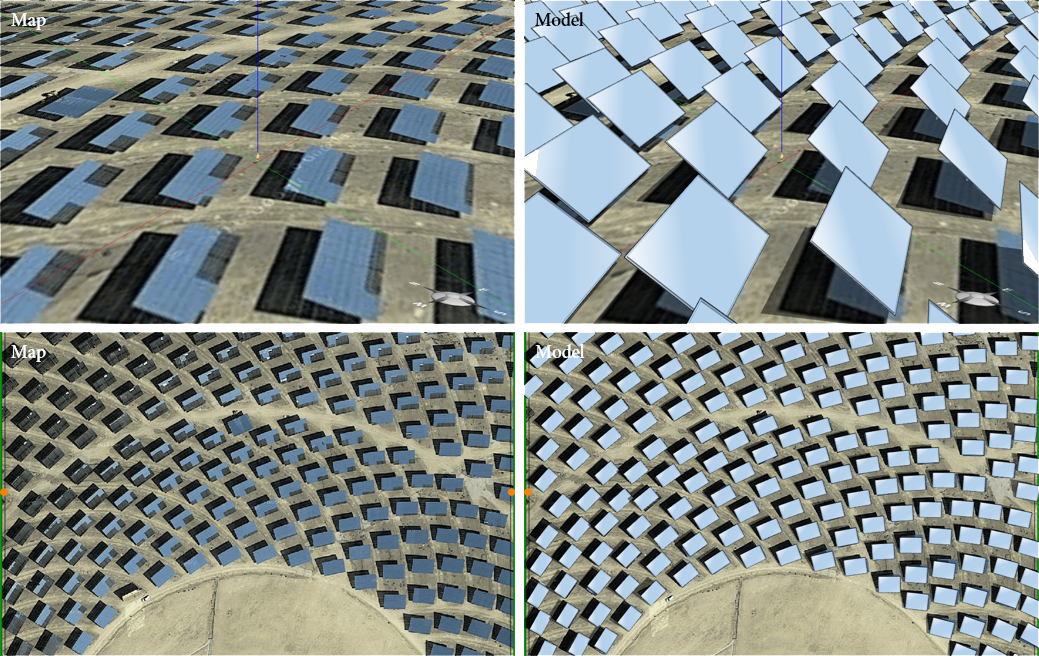 |
| Fig. 5: Superimposed heliostats on top of map images (PS20) |
The layout wizard provides a baseline model that you can always modify manually to get what you want (Figure 4). All heliostats can be easily dragged, dropped, or removed.
If you want to model after an existing CSP station, you can use the Geo-Location menu of Energy3D to import a map image of the station and then superimpose 3D heliostats on top of the map image where the images of the actual heliostats are located. Figure 5 shows that an Energy3D model of the PS20 station can be perfectly created using this method. The shadows on the ground cast by the heliostats in the Energy3D model even aligns very well with those captured in the map image (I must confess that I tried to guess the right date and time from the shadow of the tower and the rest just follows).
One thought on “Designing heliostat layouts of concentrated solar power stations with Energy3D”
Comments are closed.
How could I find the detailed information of the heliostat layout in PS20?