 |
| Fig.1: Annual air and ground temperatures (daily averages) |
A building exchanges heat not only with the outside air but also with the ground. The ground temperature depends on the location and the depth. At six meters under and deeper, the temperature remains almost constant throughout the year. That constant temperature roughly equals to the mean annual air temperature, which depends on the latitude.
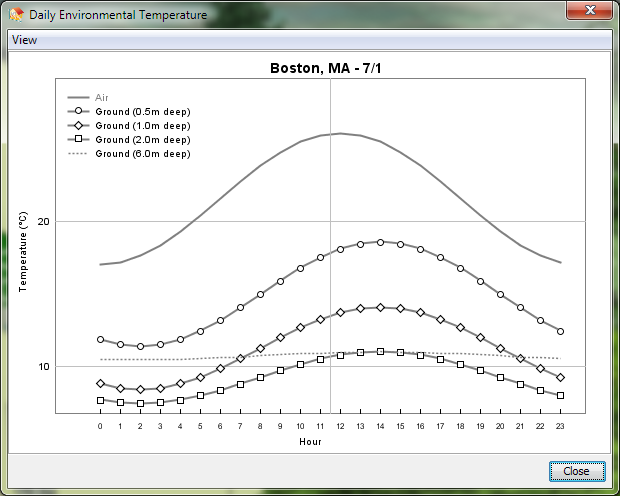 |
| Fig.2: Daily air and ground temperatures on 7/1 |
The ground temperature has a variation pattern different from that of the air temperature. You may experience this difference when you walk into the basement of a house from the outside in the summer or in the winter at different times of the day.
For our Energy3D CAD software to account for the heat transfer between a building and the ground at any time of a year at the 220 worldwide locations that it currently supports, we must develop a physical model for geothermal energy. While there is an abundance of weather data, we found very little ground data (ground data are, understandably, more difficult and expensive to collect). In the absence of real-world data, we have to rely on mathematical modeling.
 |
| Fig.3: Daily air and ground temperatures on 1/1 |
This mission was accomplished in Version 4.9.3 of Energy3D, which can now simulate the heat transfer with the ground. This geothermal model also opens up the possibility to simulate ground source heat pumps — a promising clean energy solution, in Energy3D (which aims to ultimately include various renewable energy sources in its design capacity to support energy engineering).
Exactly how the math works can be found in the User Guide. In this blog post, I will show you some results. Figure 1 shows the daily averages of the air and ground temperatures throughout the year in Boston, MA. There are two notable features of this graph: 1) Going more deeply, the temperature fluctuation decreases and eventually diminishes at six meters; and 2) the peaks of the ground temperatures lag behind that of the air temperature, due to the heat capacity of the ground (the ground absorbs a lot of thermal energy in the summer and slowly releases them as the air cools in the fall).
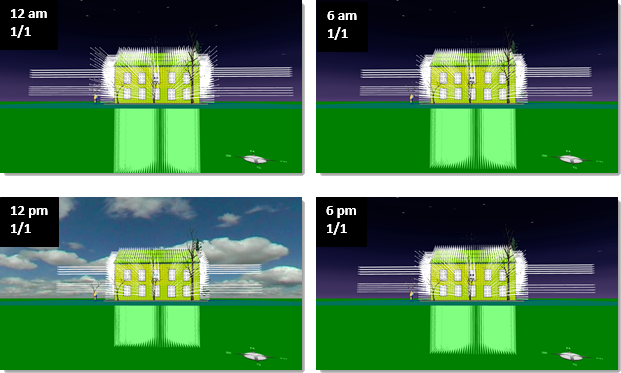 |
| Fig. 4: Four snapshots of heat transfer with the ground on a cold day. |
In addition to the annual trend, users can also examine the daily fluctuations of the ground temperatures at different depths. Figure 2 shows the results on July, 1. There are three notable features of this graph: 1) Overall the ground temperature decreases when we go deeper; 2) the daily fluctuation of the ground temperature decreases when we go deeper; and 3) the peaks of the ground temperatures lag behind the peak of air temperature. Figure 3 shows the results on January 1 with a similar trend, except that the ground temperatures are higher than the air temperature.
Figure 4 shows four snapshots of the heat transfer between a house and the ground at four different times (12 am, 6 am, 12 pm, and 6 pm) on January 1. The figure shows arrays of heat flux vectors that represent the direction and magnitude of heat flow. To exaggerate the visualization, the R-values of the floor insulation and the windows were deliberately set to be low. If you observe carefully, you will find that the change in the magnitude of the heat flux vectors into the ground lags behind that of those into the air.
The geothermal model also includes parameters that allow users to choose the physical properties of the ground, such as thermal diffusivity. For example, Dry land tends to have smaller thermal diffusivity than wet land. With these properties, geology also becomes a design factor, making the already interdisciplinary Energy3D software even more so.