 |
| Fig. 1 2D view of Concord Consortium building in Energy3D |
Solar design depends on accurate geometry. Rooftop solar panel design requires accurate 3D models of buildings, for example the shape of the roof, the height of the building, and the surrounding objects such as trees. Likewise, solar power station design requires accurate information about the field.
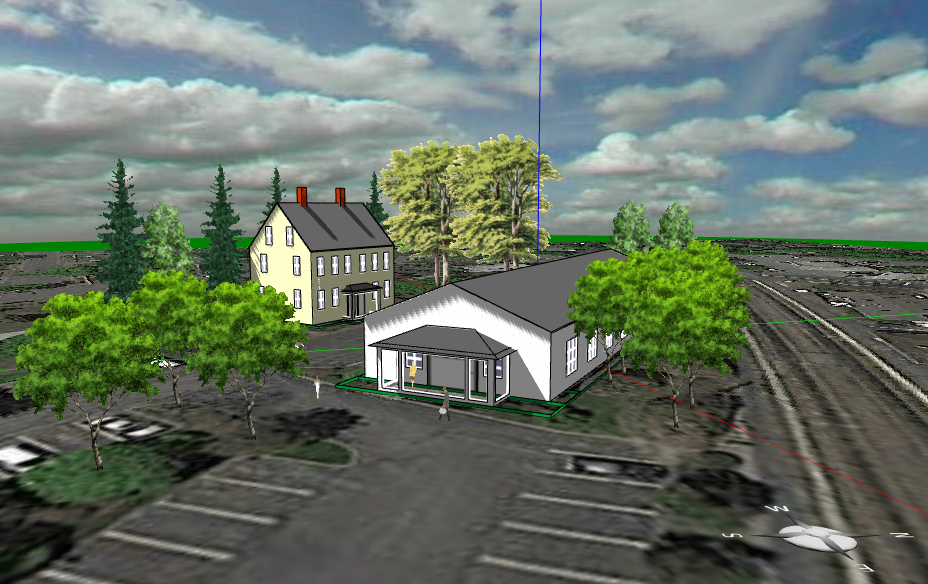 |
| Fig. 2 3D view of Concord Consortium building in Energy3D |
The easiest way to obtain these information is through Google Map, from which the dimension of an object can be measured. Although Google Map has not provided elevation data for a point yet, Google Earth does for many towns.
Earlier this year, students who performed solar design with Energy3D in our pilot tests must use Google Earth to retrieve the geometrical data for use in Energy3D design later. Having to master two sophisticated software tools simultaneously in a short time has turned out to be quite a challenge to many students. So an idea came to our mind: Why not just make Google Earth work within Energy3D? (Note: In fact, this is also a common feature among CAD software such as SketchUp.)
 |
| Fig. 3 Solar heat map of Concord Consortium building |
It turned out that this integration is fairly simple, because Google has done the hard part of providing an easy-to-use Web API for virtually every platform. So in the latest version of Energy3D (V5.8.2 or higher), users will have an internal Google Map ready to help them with their solar designs.
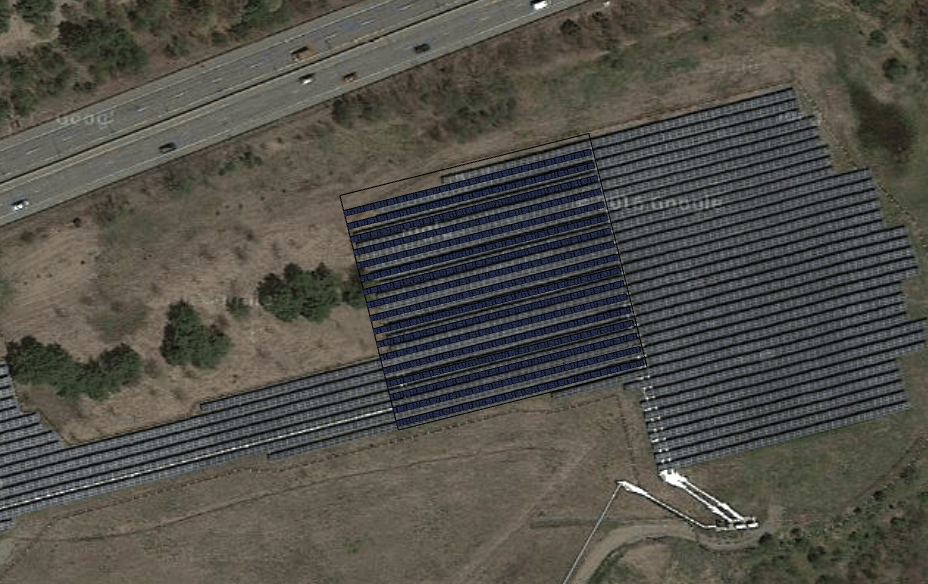 |
| Fig. 4 2D view of a solar farm in Concord, MA in Energy3D |
Solar designers can specify a target location in Energy3D and then a Google Map image will be downloaded and used to overlay the ground in Energy3D. They can then draw a 3D building on top of this image by tracing the envelope of the building, eliminating the need to set the dimension of each side numerically. Figures 1-3 demonstrate the result of this new feature using the Concord Consortium’s office building as an example.
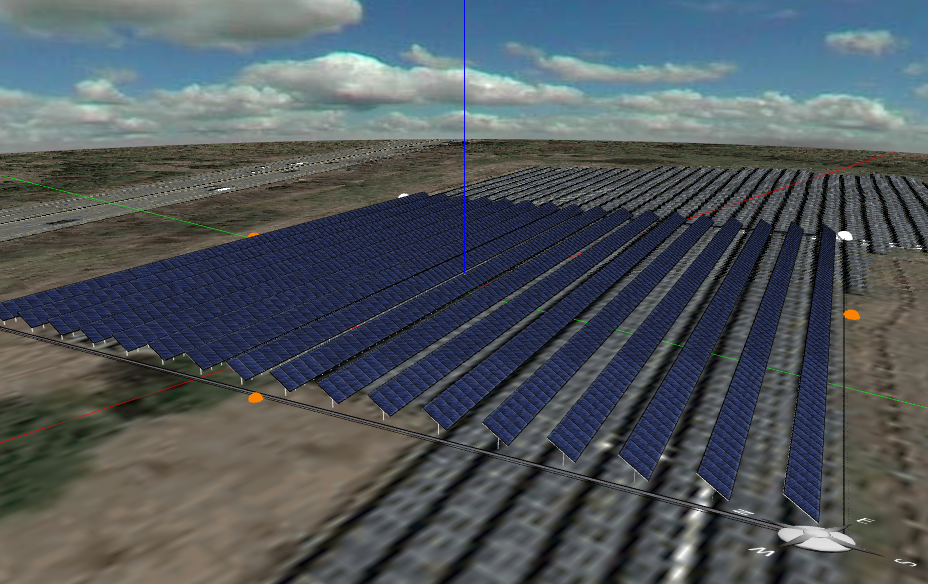 |
| Fig. 5 3D view of a solar farm in Concord, MA in Energy3D |
A remarkable advantage brought by this feature is that it is easy to add model trees on top of the images of surrounding trees. A future version will also allow users to adjust the height and spread of a model tree based on the Google Map image.
Other than assisting designers to acquire site data, the map image also provides a rendering of how a new design may look like in an environment with existing buildings (just pretend for a moment that the building in Figure 2 hadn’t existed and were a proposal to build two new houses at the site). Furthermore, with Google Map’s elevation API, we will also be able to construct a terrain model of the ground (which is currently flat). Such a terrain model will not only make the energy simulation more accurate by taking all the surrounding objects into account but also make the rendering more realistic by giving the 2D map image a 3D effect (similar to the new 3D view of Google Map).
Based on Energy3D, we have created two solar design challenges for students to make meaningful contributions to the solarization movement. One is to solarize their own houses by designing rooftop solar panels. The other is to solarize their own schools and towns by designing solar farms (Figures 4 and 5). Aligned with the Next Generation Science Standards (NGSS) that require students to think and act like scientists and engineers, our goal is to engage students to practice science and engineering through solving real-world problems. But real-world problems are often complex and difficult (otherwise they are not problems in the real world!). This calls for the development of advanced tools that can empower students to tackle real-world problems. Our Energy3D software provides examples of how technology may knock down the barriers and help students attain the high standards set by the NGSS.